Updated July 2026: This guide has been refreshed to clarify market-data limitations, add current API and broker-integration context, and update Python/dependency recommendations for modern trading dashboards.
Introduction to Integration Benefits
Integrating charting tools with stock trading platforms gives traders a practical advantage: faster visual analysis, cleaner workflows, and fewer manual steps between spotting a setup and placing an order. As trading platforms become more data-driven in 2026, the ability to connect charts, data feeds, alerts, and order logic is useful for both beginners testing ideas and experienced traders refining strategies.
Key benefits include:
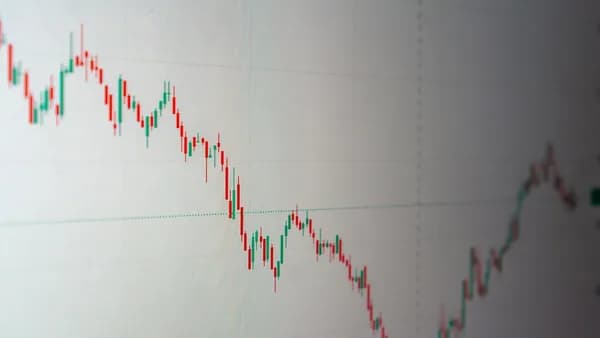
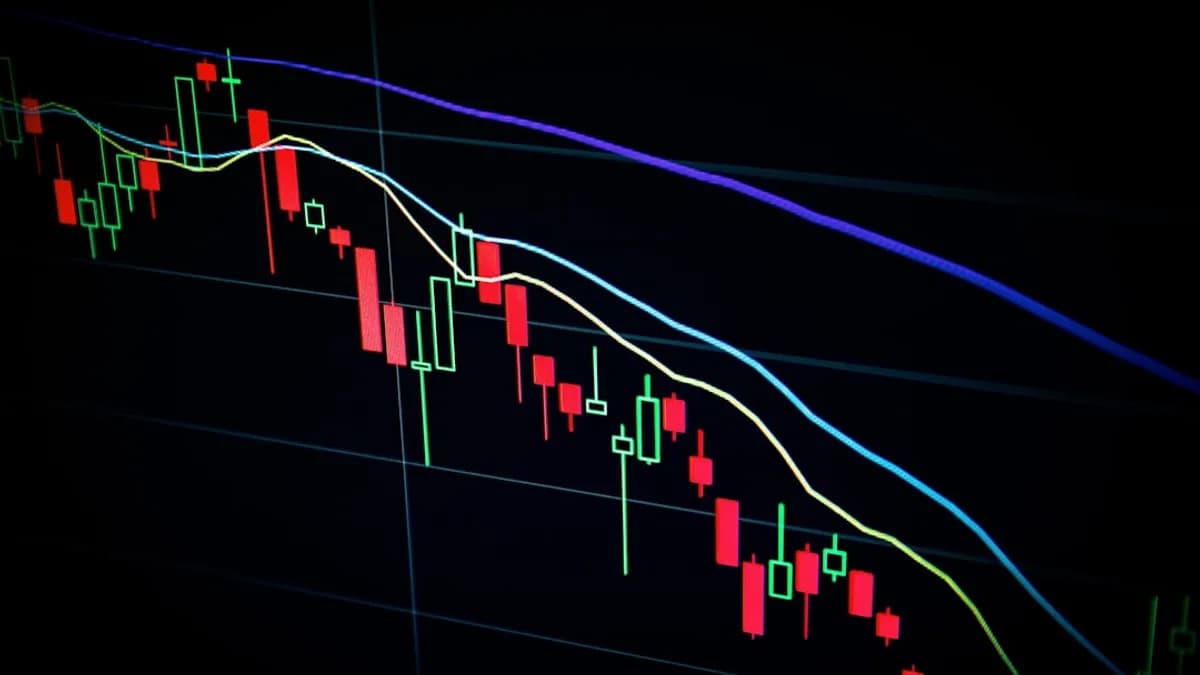
- Enhanced analysis: Interactive charts help traders identify trends, volatility shifts, support/resistance, and technical patterns.
- More efficient execution: Linking chart views to watchlists, order tickets, or simulated trades reduces friction.
- Better risk management: Alerts, stop-loss levels, position sizing, and limit orders can be tied to chart-based conditions.
- Strategy testing: Simulators and paper-trading environments let users test chart-driven workflows without risking capital.
The open-source Stocks-Simulator project remains a useful example of a Python-based trading dashboard that combines market data, charting, portfolio tracking, and educational features.
Commonly Used Charting Tools and Trading Platforms
Charting Tools
For Python-based trading dashboards, commonly used charting and data tools include:
- Plotly: Interactive, web-friendly charts suitable for dashboards and candlestick visualizations.
- Matplotlib: Reliable static charts for reports, research, and historical analysis.
- Pandas: Data cleaning, transformation, resampling, and basic plotting.
- TA-Lib / pandas-ta: Popular options for adding technical indicators such as RSI, MACD, Bollinger Bands, and moving averages.
Stock Trading Platform Components
The Stocks-Simulator model reflects a common lightweight architecture:
- Python 3.x: Core application logic.
- yfinance: Convenient access to Yahoo Finance market data, though not a guaranteed real-time or institutional-grade feed.
- Streamlit: Web dashboard framework for rapid app development.
- SQLite: Lightweight storage for transactions, users, and portfolios.
In production or live-trading environments, developers often add broker or data APIs such as Alpaca, Interactive Brokers, Tradier, Polygon.io, IEX Cloud, or Nasdaq Data Link, depending on asset class, latency needs, licensing, and budget.
| Tool | Key Strength | Typical Use Case |
|---|---|---|
| Plotly | Interactive charting | Live dashboards, candlesticks, indicators |
| Matplotlib | Static visualization | Research, reports, historical review |
| Pandas | Data manipulation | Resampling, returns, indicators |
| Streamlit | Dashboard UI | Rapid web-based trading tools |
| SQLite | Local database | Portfolios, trades, preferences |
Prerequisites for Integration
Before you integrate charting tools with stock platforms, confirm that your environment and data sources are ready.
Minimum requirements commonly include:
- Python 3.9 or higher; Python 3.10+ is recommended for newer libraries.
- pip or another package manager such as Poetry or uv.
- Reliable internet connection for market data and API calls.
- API credentials if using broker, premium data, or execution services.
- Basic debugging skills using terminal logs, Streamlit logs, browser DevTools, or IDE debugging tools.
The Stocks-Simulator documentation lists Python, pip, and internet access as key prerequisites. A typical setup looks like this:
git clone https://github.com/virtual457/Stocks-Simulator.git
cd Stocks-Simulator
pip install -r requirements.txt
streamlit run app.py
For a fresh build, consider using a virtual environment:
python -m venv .venv
source .venv/bin/activate
pip install streamlit plotly pandas yfinance
Step 1: Selecting Compatible Charting Tools and Platforms
Compatibility is the foundation of a stable integration. The right charting library should work smoothly with your data source, dashboard framework, and trading or simulation engine.
1. Identify Integration Points
Ask these questions before choosing tools:
- Does the platform support Python, JavaScript, REST APIs, or WebSockets?
- Can chart data be updated automatically?
- Does the broker or simulator expose order, portfolio, and account functions?
- Are you building for research, paper trading, or live execution?
For Python dashboards, Plotly and Streamlit remain a strong pairing because Plotly charts can be embedded directly in Streamlit interfaces.
2. Match Features to Use Case
| Requirement | Suitable Option |
|---|---|
| Interactive charts | Plotly |
| Static research charts | Matplotlib |
| Fast data wrangling | Pandas |
| Technical indicators | pandas-ta, TA-Lib, custom formulas |
| Paper trading | Simulator, Alpaca paper, broker sandbox |
| Live execution | Broker API with proper risk controls |
Recommendation: Use Python-based tools for research, simulation, and dashboards. For live trading, separate charting, signal generation, and order execution into clearly tested modules.
Step 2: Setting Up API Connections and Data Feeds
A chart is only as good as the data behind it. For educational projects, yfinance is simple and widely used. For trading decisions that require accuracy, uptime, or low latency, use licensed market-data providers or broker feeds.
1. Configure the Market Data API
Install yfinance for basic market data:
pip install yfinance
Example:
import yfinance as yf

data = yf.download("AAPL", period="5d", interval="5m", auto_adjust=False)
Important note: yfinance is useful for prototypes and education, but Yahoo Finance data can be delayed, adjusted, rate-limited, or unavailable. Always verify data terms and quality before relying on it for trading.
2. Feed Data into Charting Tools
import plotly.graph_objects as go

fig = go.Figure(data=[go.Candlestick(
    x=data.index,
    open=data["Open"],
    high=data["High"],
    low=data["Low"],
    close=data["Close"]
)])

fig.update_layout(title="AAPL Candlestick Chart", xaxis_rangeslider_visible=False)
fig.show()
3. Integrate With the Dashboard
import streamlit as st

st.title("Stock Chart Dashboard")
st.plotly_chart(fig, use_container_width=True)
For more advanced integrations, use WebSockets or broker streaming APIs to update prices without repeatedly polling the same endpoint.
Step 3: Configuring Charting Tools within Trading Platforms
Once your data pipeline works, the next step is embedding charts into the platform workflow.
1. Integrate Chart Widgets
Use dashboard controls for ticker selection, timeframe, chart type, and indicators:
ticker = st.sidebar.text_input("Ticker", "AAPL")
chart_type = st.sidebar.selectbox("Chart Type", ["Candlestick", "Line"])
2. Add Indicator Controls
Let users toggle common indicators:
show_sma = st.sidebar.checkbox("Show 20-period SMA")

if show_sma:
    data["SMA20"] = data["Close"].rolling(20).mean()
    fig.add_trace(go.Scatter(
        x=data.index,
        y=data["SMA20"],
        mode="lines",
        name="SMA 20"
    ))
3. Link Charts to Trading Actions
In a simulator, chart panels can connect to buy/sell buttons, position views, and watchlists. In a live-trading system, add safeguards:
- Confirm order details before submission.
- Validate quantity, buying power, and position limits.
- Use paper trading before enabling real execution.
- Log every order request and response.
| Feature | Example Implementation |
|---|---|
| Chart selection | Streamlit sidebar controls |
| Indicator toggles | Checkbox-driven calculations |
| Watchlist | SQLite or session-state storage |
| Trade action | Button linked to simulated or broker order logic |
| Risk control | Stop-loss, limit price, max position size |
Step 4: Customizing Layouts and Alerts
Customization turns a basic dashboard into a usable trading workspace.
1. Custom Layouts
Allow users to save preferences such as:
- Default ticker list
- Preferred timeframes
- Indicator combinations
- Chart type and theme
- Risk settings
These can be stored in SQLite for local apps or a managed database for multi-user platforms.
2. Alerts and Notifications
Alerts can be based on price, volume, or indicators:
moving_average = data["Close"].rolling(20).mean().iloc[-1]

if data["Close"].iloc[-1] > moving_average:
    st.warning("Price is above the 20-period moving average.")
Common alert types include:
- Price crosses above or below a threshold
- Moving-average crossover
- RSI overbought/oversold conditions
- Unusual volume
- Stop-loss or take-profit trigger
For production alerts, consider email, SMS, push notifications, Slack/Discord webhooks, or broker-native alerts.
Troubleshooting Common Integration Issues
1. Data Feed Errors
Symptom: Charts are blank, stale, or missing recent candles.
Fix: Check API status, ticker symbol format, market hours, rate limits, and whether your data source provides real-time or delayed quotes.
2. Incompatible Library Versions
Symptom: Import errors, broken charts, or Streamlit rendering failures.
Fix: Use a virtual environment, pin dependencies, and update packages carefully.
pip freeze > requirements.txt
3. Chart Rendering Issues
Symptom: Candles look incorrect or data appears misaligned.
Fix: Confirm column names, index type, timezone handling, and whether prices are adjusted or unadjusted.
4. Trading Action Failures
Symptom: Orders fail or simulated trades do not update portfolios.
Fix: Log order parameters, validate account state, and separate UI code from order-management logic. For broker APIs, inspect error codes and authentication settings.
5. Slow Dashboards
Symptom: Charts lag or reload too often.
Fix: Cache data where appropriate, limit candle history, use streaming for live quotes, and avoid recalculating indicators unnecessarily.
Best Practices for Maintaining Integration
To keep charting and trading integrations reliable:
- Keep dependencies updated but test before deploying changes.
- Pin library versions for reproducible builds.
- Use secure credential storage; never hard-code API keys.
- Monitor data quality across providers and timeframes.
- Add fallback data sources if uptime matters.
- Use version control for all integration code.
- Test order logic in simulation or paper trading before live use.
- Log signals, alerts, and trades for review and debugging.
Also remember that charting tools support decision-making; they do not eliminate market risk. Backtesting, paper trading, and risk controls remain essential.
Conclusion: Maximizing Trading Efficiency Through Integration
Learning how to integrate charting tools with stock platforms helps traders create a faster, clearer, and more disciplined workflow. Python, Plotly, Pandas, Streamlit, SQLite, and yfinance provide an accessible starting point, as demonstrated by projects like Stocks-Simulator.
For serious trading use, upgrade the data layer, add broker-grade APIs, secure credentials, and test execution logic carefully. The best integrations combine interactive charts, reliable data, risk controls, and clean order workflows in one environment.
FAQ: Integrate Charting Tools Stock Platforms
Q1: What are the main benefits of integrating charting tools with stock trading platforms?
A1: Integration improves visual analysis, speeds up workflows, supports alerts, and helps connect technical signals with simulated or live order actions.
Q2: Which charting tools work well with Python trading dashboards?
A2: Plotly, Matplotlib, Pandas, pandas-ta, and TA-Lib are commonly used. Plotly is especially useful for interactive dashboards.
Q3: Is yfinance real-time enough for trading?
A3: yfinance is useful for education and prototyping, but it is not a guaranteed institutional real-time feed. For live trading, consider broker or licensed data APIs.
Q4: What prerequisites are required?
A4: Use Python 3.9 or higher, pip or another package manager, a stable internet connection, and API credentials if connecting to broker or premium data services.
Q5: What should I do if my charts are not displaying correctly?
A5: Check the data feed, package versions, ticker format, column names, timezone handling, and chart configuration.
Q6: How can I keep my integration stable?
A6: Pin dependencies, use version control, monitor APIs, secure credentials, test regularly, and validate trading logic in a simulator before using live execution.
Bottom Line
Integrating charting tools with stock trading platforms can improve analysis, speed, and risk management. Start with a simple Python stack such as Plotly, Pandas, Streamlit, SQLite, and yfinance for learning or simulation. For live trading, use reliable market-data and broker APIs, secure your credentials, and test every workflow before placing real orders.