For modern stock traders, choosing the right charting tool can make or break your trading strategy. With the explosion of digital trading platforms and sophisticated analysis software, understanding the essential features stock trading charting tools provide is crucial for anyone aiming to maximize their technical analysis and decision-making. This guide dives deep into the must-have attributes—grounded in real research data—to help you select charting software that meets your needs in 2026.
Why Charting Tools Are Critical for Stock Traders
Stock trading has evolved dramatically since the first ticker tape in the 1800s. As highlighted by Day Trader Business, today's charting tools are essential for transforming raw data into actionable insights. These tools:
- Enable traders to visualize market movements
- Support technical analysis through a variety of chart types and indicators
- Provide real-time data for timely decisions
"Charting tools enhance data visualization by providing essential features like customizable charts, interactive dashboards, and real-time data updates."
— Day Trader Business
Without robust charting tools, traders risk making decisions based on outdated or incomplete information. Whether you're a beginner or a seasoned investor, charting software is a core component in the trading toolkit.
Real-Time Data and Chart Refresh Rates
One of the most essential features stock trading charting tools offer is real-time data updates. According to Day Trader Business:
- Real-Time Data Updates: Provide instant access to the latest market information
- Timely Decision-Making: Help identify trends as they develop and enable quick strategy adjustments
"Real-time data in charting tools is crucial because it provides immediate insights into market movements, enabling traders to make timely decisions."
— Day Trader Business
Why Real-Time Matters
- Accuracy: Reduces the risk of acting on outdated information
- Agility: Empowers users to react swiftly to changes, maximizing potential gains and minimizing losses
If a charting tool lacks real-time refresh, it can compromise your trading outcomes. Always verify that your chosen platform updates charts and data instantly.
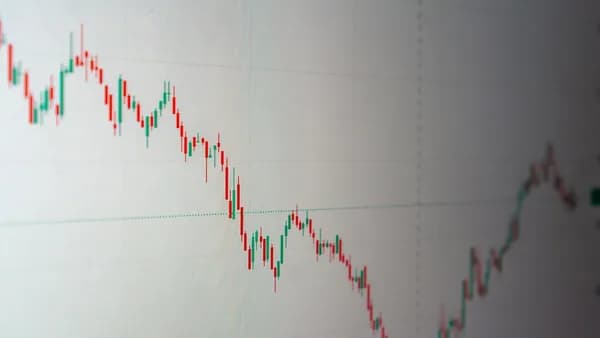
Variety of Chart Types and Customization Options
A robust charting tool should support multiple visualization formats and allow customization.
Supported Chart Types
Day Trader Business lists:
- Line Charts
- Bar Charts
- Candlestick Charts
- Pie Charts
- Scatter Plots
- Area Charts
- Histograms
Some platforms also offer advanced options like:
- Heat Maps
- Bubble Charts
- Radar Charts
Customization Features
- Colors and Styles: Modify chart appearance for clarity and personal preference
- Data Types: Select which data to display—price, volume, etc.
- Templates: Save and reuse custom chart layouts
"Customizable templates enhance charting tools by allowing users to tailor visuals to their specific needs."
— Day Trader Business
| Chart Type | Use Case | Customizable? |
|---|---|---|
| Line | Trend analysis | Yes |
| Candlestick | Price action, trading signals | Yes |
| Bar | Volume and price comparisons | Yes |
| Pie | Proportion visualizations | Yes |
| Scatter | Correlation analysis | Yes |
| Area | Cumulative values | Yes |
| Histogram | Distribution analysis | Yes |
Technical Indicators and Drawing Tools Availability
Technical analysis relies heavily on built-in indicators and drawing tools.
Key Indicators
Day Trader Business identifies:
- Moving Averages
- Relative Strength Index (RSI)
- Moving Average Convergence Divergence (MACD)
Drawing Tools
- Trend Lines
- Fibonacci Retracements
- Annotations
These features help traders dissect price movements, identify patterns, and annotate charts for future reference.
"Built-in tools like moving averages, RSI, and MACD are essential features of effective charting tools."
— Day Trader Business
| Feature | Purpose |
|---|---|
| Moving Average | Smoothing price data |
| RSI | Identifying overbought/oversold |
| MACD | Momentum and trend detection |
| Trend Line | Visualizing support/resistance |
| Fibonacci | Predicting retracement points |
| Annotation | Adding notes/labels |
User Interface and Ease of Navigation
A user-friendly interface is a non-negotiable feature. According to Day Trader Business:
- Intuitive Design: Ensures easy navigation for both beginners and advanced users
- Quick Chart Creation: Reduces learning curve and enhances productivity
What to Look For
- Clean Layouts
- Accessible Menus
- Drag-and-Drop Functionality
- Responsive Controls
"User-Friendly Interface: Intuitive design for easy navigation."
— Day Trader Business
Test charting tools via demos or free trials to assess their usability before committing.
Integration with Trading Platforms and Brokers
Seamless integration is another essential feature stock trading charting tools must provide.
Integration Options
- APIs: Connect to live data feeds, brokers, and external software
- Direct Database Connect: Sync with proprietary or third-party data
- Trading Platform Compatibility: Ensure your charting tool works with your preferred broker
"Integration with Other Tools: Seamless connection with trading platforms and data feeds."
— Day Trader Business
| Integration Type | Benefit |
|---|---|
| API | Real-time data, automation |
| Direct Database | Historical data analysis |
| Trading Platform Sync | Execute trades from charts |
If you use multiple platforms, confirm compatibility before selection.
Backtesting and Strategy Simulation Features
Backtesting lets traders test strategies on historical data before risking capital.
- Backtesting Capabilities: Evaluate performance against past market conditions
- Strategy Simulation: Adjust parameters and see potential outcomes
"Backtesting Capabilities: Ability to test strategies against historical data."
— Day Trader Business
| Feature | Functionality |
|---|---|
| Backtesting | Simulate trades using history |
| Simulation | Experiment with strategies |
Look for tools that support these features to refine your trading methods.
Alert Systems and Notification Options
Alert systems keep traders updated on key events and price movements.
- Price Alerts: Notify when a security hits a certain level
- Custom Notifications: Set reminders for economic releases or technical triggers
"Export Options: Easy saving and sharing of charts as images or reports."
— Day Trader Business
While export options are important, alerts and notifications are vital for proactive trading. Evaluate each tool’s alert system for flexibility and reliability.
Mobile Compatibility and Cloud Syncing
Modern traders need access on the go. Mobile compatibility and cloud syncing are now standard expectations.
- Mobile Compatibility: Analyze markets from smartphones and tablets
- Cloud Syncing: Access saved charts and settings across devices
"Mobile Compatibility: Access on smartphones and tablets for on-the-go analysis."
— Day Trader Business
| Feature | Benefit |
|---|---|
| Mobile Access | Trade anywhere, anytime |
| Cloud Sync | Consistent experience |
Test mobile apps for responsiveness and usability before adoption.
Security and Data Privacy Considerations
Security is paramount, especially when integrating with brokers and handling sensitive data.
- Data Privacy: Ensure your information and trading history are protected
- Secure Connections: Look for encrypted data transfers and robust authentication
At the time of writing, Day Trader Business does not provide specific security benchmarks for charting tools. However, traders should prioritize platforms with:
- Industry-standard encryption
- Clear privacy policies
- Regular updates and security patches
"How do you make sure your website works properly? ... basic troubleshooting steps." — MDN Web Development (applies to software security and performance checks)
FAQ
Q1: What are the essential features stock trading charting tools must have?
A: User-friendly interface, customizable charts, real-time data updates, technical indicators, multiple chart types, drawing tools, backtesting, export options, mobile compatibility, and integration with trading platforms (Day Trader Business).
Q2: Why is real-time data important in charting tools?
A: Real-time data enables immediate insights into market movements and supports timely decision-making, accuracy, and agility in trading (Day Trader Business).
Q3: What chart types should my tool support?
A: Line, bar, candlestick, pie, scatter, area, histogram, and advanced visualizations like heat maps and bubble charts (Day Trader Business).
Q4: How do technical indicators and drawing tools assist traders?
A: They help analyze price trends, identify trading signals, and annotate charts for strategy refinement (Day Trader Business).
Q5: Is mobile compatibility necessary?
A: Yes, it allows traders to analyze and act on market opportunities from anywhere, ensuring flexibility and responsiveness (Day Trader Business).
Q6: How can I ensure my charting tool is secure?
A: Look for platforms with strong privacy policies, data encryption, and regular security updates. Test performance and troubleshoot as recommended by MDN Web Development.
Bottom Line
The research confirms that the essential features stock trading charting tools should deliver include real-time data, diverse chart types, customization, robust technical indicators, intuitive interfaces, seamless platform integration, backtesting, alert systems, mobile compatibility, and strong security. These attributes collectively empower traders to analyze markets efficiently, make informed decisions, and stay competitive in 2026. Always assess your unique needs, test tools via free trials, and prioritize usability and integration to maximize your trading performance.