Geopolitical Tensions Trigger Sudden Bitcoin Price Correction Below $80,000
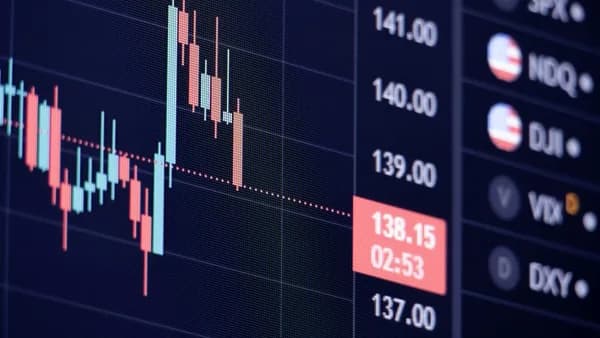
Bitcoin’s tumble from $81,500 to $79,000 wasn’t just another technical retracement—it was a direct response to headlines of U.S. forces striking Iranian targets, a spike in global risk that rattled crypto traders almost instantly. The sector’s “digital gold” narrative has always been a double-edged sword: in theory, Bitcoin should thrive when traditional markets panic, but in practice, it often sells off alongside risk assets when real-world conflict escalates. Within minutes of the news breaking, top exchanges saw liquidation volumes surge nearly 40%, with over $550 million wiped from leveraged positions across majors, according to aggregated derivatives data.
This reflexive selling reveals a deeper truth about investor psychology. While some still cling to the idea that Bitcoin is a hedge against geopolitical chaos, the reality is that the market behaves more like a leveraged bet on global risk appetite. When uncertainty spikes, traders dump positions to raise cash and control risk, regardless of whether the asset is “hard money” or not. The drop below $80,000 aligns with similar moves seen during Russia’s invasion of Ukraine in early 2022, when Bitcoin lost 9% in one session amid a scramble to liquidate.
Sentiment shifted rapidly, evidenced by a sharp spike in the Crypto Fear & Greed Index, which plunged from “Greed” to “Fear” within hours. This isn’t just about price—it’s about the collective conviction of thousands of traders recalibrating in real time. While global conflict can sometimes spark short-lived rallies in Bitcoin, the dominant pattern remains volatility, not safe haven status. The market’s reaction this week exposes the fragility of the “digital gold” thesis, at least when the headlines are truly seismic, according to CoinDesk.
Decoding the Record-Breaking 67-Day Streak of Negative Crypto Futures Funding Rates
Crypto futures markets have now logged 67 consecutive days of negative funding rates—an anomaly not seen in a decade. For context, a negative funding rate means short positions (betting prices will fall) are so dominant that longs must pay shorts to keep their contracts open. It’s a direct signal that sentiment is deeply bearish, with traders refusing to pay a premium for upside exposure.
Why does this matter? Funding rates are the heartbeat of speculative positioning. When they turn negative and stay there, it means traders are consistently betting against price rallies—even as underlying spot prices occasionally bounce. The last time funding rates stayed negative for more than a month was during the 2015 post-Mt. Gox bear market, which saw Bitcoin languish below $300 for weeks as traders braced for further declines.
This 67-day streak stands out not just for its length, but for what it says about the broader mood. Large institutional volumes are increasingly flowing into short-biased strategies. Even perpetual swap markets—typically a haven for bullish leverage—are now dominated by shorts, with open interest hitting $12.4 billion, up 22% from March. The persistence of negative funding isn’t just a curiosity; it’s a flashing warning light that traders expect more downside or at best, sideways chop.
A decade-long record means this isn’t just cyclical noise. It’s a structural shift in how crypto traders are positioning against macro headwinds, regulatory uncertainty, and ongoing risk-off sentiment.
Data Deep Dive: Bitcoin’s Price Fluctuations and DOGE’s Leading Losses in Context
Bitcoin’s chart tells a story of whiplash volatility. After peaking at $81,500 early in the week, the price cratered to $79,000 in hours, down 3%—but the real carnage played out in altcoins. Dogecoin led the rout, plunging nearly 8% in a single trading day, outpacing losses in Ethereum (-4%), Solana (-5%), and XRP (-3.5%). DOGE’s slide is hardly random: speculative meme coins tend to sell off fastest when funding rates turn negative, as leverage unwinds and risk tolerance evaporates.
Volume data underscores the panic. Spot trading on Binance and Coinbase jumped 35% as traders rushed to exit positions. DOGE futures saw liquidations totaling $47 million—more than double its daily average—hinting at aggressive margin calls and forced selling. This isn’t just “volatility as usual.” Compared to the May 2022 Luna collapse, where DOGE dropped 12% in two days, this week’s action is milder but still outsized relative to its peers.
Why is DOGE hit hardest? The meme coin’s retail-driven base is more sensitive to sentiment shocks. When funding rates go negative, leveraged longs—often retail traders chasing quick gains—are squeezed out first. The pattern mirrors the November 2021 correction, when DOGE lost 15% after Bitcoin fell 6%, showing the outsized impact of speculative flows on its price.
Historical volatility metrics reinforce the point: the 30-day realized volatility for Bitcoin rose to 5.3% (from 4.1%), while DOGE spiked to 8.7%. The spread between the majors and speculative coins widens in times of stress, confirming that risk-off moves hit meme assets hardest. This week’s data is a textbook example of how negative funding and geopolitical risk can cascade through the crypto complex, with the most leveraged and speculative assets bearing the brunt.
Diverse Stakeholder Reactions: Traders, Investors, and Institutional Players Weigh In
Retail traders are feeling the sting. Crypto Twitter lit up with frustrated posts about margin calls and forced liquidations, especially from those holding DOGE and other high-beta altcoins. Many are shifting to stablecoins or hedging with short futures, reflecting a tactical retreat rather than doubling down on “buy the dip” optimism.
Institutional players, however, are running a different playbook. Major funds like Pantera and Galaxy Digital have reduced net long exposure, according to recent CFTC position data, and increased allocation to cash and short-biased strategies. This risk management pivot is notable: institutions are less reactive to headlines and more attuned to structural market signals like sustained negative funding rates and liquidity crunches.
Expert analysts, including K33 Research, warn that the current environment is unsustainable. Persistent negative funding rates typically precede either sharp reversals (as shorts cover en masse) or prolonged bear phases. Some see echoes of the 2018-2019 bear market, when negative funding signaled capitulation before a surprise rally. But unlike past cycles, today’s macro backdrop—higher rates, regulatory uncertainty, and geopolitical stress—means the path forward is less predictable.
The divide between retail and institutional sentiment is widening. Retail traders are battered by volatility and margin risk, while institutions are sitting on the sidelines, waiting for clearer signals. This bifurcation could drive further price swings as liquidity thins and each group reacts to different catalysts.
Historical Parallels: Comparing Current Crypto Market Dynamics to Past Geopolitical Events
Bitcoin’s sensitivity to geopolitical shocks is nothing new—but the funding rate anomaly adds a new wrinkle. In 2017, during the North Korean missile tests, Bitcoin lost 12% in three days only to rebound by 25% as global risk appetite returned. The market’s response was sharp but short-lived, and funding rates normalized within weeks.
Contrast that with the 2022 Russia-Ukraine invasion. Bitcoin dropped 9% in a day, but negative funding rates persisted for nearly 30 days, reflecting deeper uncertainty. The pattern was clear: geopolitical conflict triggers sell-offs, but the duration and depth of funding rate negativity depend on the perceived longevity of the risk.
This time, the 67-day negative streak dwarfs previous episodes. The difference? The current market is navigating not just war headlines, but also macro tightening, regulatory crackdowns, and a hangover from earlier speculative excess. Historical data shows that when negative funding rates outlast the immediate crisis, it often signals broader structural bearishness, not just knee-jerk selling.
Lessons from past events: short-lived geopolitical shocks tend to be followed by V-shaped recoveries, but sustained negative funding is a sign of deeper malaise. Traders who ignore this distinction risk misreading the signals and getting caught on the wrong side of the next move.
What the Current Crypto Market Trends Mean for Traders and Investors Moving Forward
Prolonged negative funding rates are more than a curiosity; they reshape risk management strategies across the board. For active traders, short-biased futures positions are now the dominant play—and those holding leveraged longs face mounting costs and liquidation risk. Spot market participants are increasingly moving to stablecoins, waiting for volatility to subside.
Portfolio diversification is crucial. With geopolitical tensions and funding rate anomalies in play, traders are reducing exposure to high-beta altcoins and focusing on assets with lower volatility and deeper liquidity, like Bitcoin and Ethereum. Some are hedging with options, buying puts to protect against further downside.
Opportunities are emerging, but they require discipline. Historically, persistent negative funding rates create conditions for short squeezes—when bearish traders are forced to cover en masse, driving prices higher. But timing is everything; premature attempts to “fade the funding” can backfire if sentiment remains bearish.
For investors, the message is clear: don’t chase speculative rallies in meme coins or illiquid assets while funding rates are negative. Instead, build positions in quality assets and keep powder dry. The correction offers a chance to reassess risk and seize bargains if the market stabilizes, but only if the underlying signals—funding, sentiment, and macro—turn.
Forecasting the Future: Potential Scenarios for Bitcoin and Crypto Markets Amid Ongoing Uncertainty
If geopolitical tensions escalate, Bitcoin could retest the $76,000-$77,000 support zone, with altcoins facing steeper losses—especially those with high leverage and retail-driven flows like DOGE, SHIB, and SOL. Should the negative funding streak persist past 75 days, the odds of a capitulation-style short squeeze rise, mirroring moves seen in late 2015 and mid-2019 when funding flipped positive after prolonged bearishness.
On the other hand, easing global tensions could spark a relief rally. If spot buying returns and shorts start covering, Bitcoin could reclaim the $81,500 mark and drag majors higher. The key trigger will be a shift in funding rates—when they move neutral or positive, it signals traders are willing to bet on upside again.
Emerging factors to watch: regulatory actions (especially in the U.S. and EU), central bank policy shifts, and stablecoin flows. An influx of institutional spot buying via ETFs could stabilize the market, but only if macro headwinds abate. Conversely, a major regulatory crackdown or new global conflict could deepen the negative funding streak and drive prices lower.
Bottom line: traders and investors should expect continued volatility, with sharp moves driven by both headlines and structural signals like funding rates. The market is poised for a decisive break—either a squeeze-driven rally or deeper correction—depending on how global risks and trader positioning evolve. Stay nimble, watch funding rates, and don’t ignore the lessons of history: the market will punish complacency, but reward discipline and timing.
⚠️ Disclaimer: This article is for informational purposes only and does not constitute financial advice. Always do your own research before making investment decisions.
The Bottom Line
- Bitcoin’s price drop highlights its vulnerability to geopolitical shocks, challenging the 'digital gold' narrative.
- Massive liquidations and negative funding rates reflect heightened risk aversion among crypto traders.
- The rapid shift from 'Greed' to 'Fear' signals growing market uncertainty, impacting investor behavior and strategy.